Software engineering is all about coding. Right?
Wrong. Well, just a little bit at least. Software engineering is way more than writing lines of code. Problem-solving, understanding complex business systems, specifying the scope of project implementation, defining contracts between clients and customers, coordination (for resource allocation, deployments, interlinked pieces of work), prioritizing, communication between colleagues or with Product Managers… the list goes on.
In fact, for many developers, coding is the easy part. You can practice this craft to perfection. Got a bug? Fix it. Data table locked and clients can’t log in? Declare an incident and fix it. Deployment of a new release failed? Fix it.
We, developers, are innate fixers. Logically minded, we love building solutions that help someone in some way. Which in itself is an innately empathetic trait.
Yet, when deadlines are tight, or the team is stretched too thin, or even when everything is going brilliantly, we can sometimes forget to work on the long list of other skills we need to do our job which doesn’t involve code. This is where having good Emotional Intelligence is incredibly valuable. Not only for yourself but a survey of hiring managers confirmed that 75% of hiring managers valued high EI over high IQ.
Firstly, what is Emotional Intelligence? As April Wensel said in her talk at PyTennessee in 2018, it’s not about sugarcoating difficult conversations or being an extrovert. Emotional Intelligence is about not being ruled by your emotions.
American psychologist, Daniel Goleman, popularised emotional intelligence and defined five key principles that underpin EI; self-awareness, self-regulation, motivation, empathy, and social skills.
How can we apply this as software engineers? We’ve broken down the five EI pillars into simple definitions and, based on extensive research and lived experiences as developers, we’ve collected some examples and tips that you can use to boost your Emotional Intelligence.
Self-awareness
Self-awareness is being able to understand your emotions and how your reactions to your emotions affect others. As a developer, it’s good to spend time reflecting on your intrinsic strengths, weaknesses, environments that you have a natural preference for, and potential situations that can trigger you. A good example of having good self-awareness is knowing how much you can do.
It happens often in teams of developers that a sprint finishes with initially committed user stories unfinished. Self-awareness enables the team to take on and commit to finishing a realistic amount of work based on the complexity and skill set of the team. An example of this may be considering whether, even on a good day, could you complete an 8-point piece of work within a working day. It’s unrealistic to commit to this if you know you would struggle or have never completed a piece of work like this in that time.
How can self-awareness help you as a developer? In a nutshell, it will help you to recognize and mitigate the impact of stress by understanding your skills and limitations accurately.
From tight deadlines to receiving constructive feedback in 1-1s to tackling criticism during code reviews to simply working in the fast-paced world of software development, the ability to recognize when you are experiencing stress will help you to limit the impact it has on your health and develop healthy coping mechanisms.
To boost your self-awareness, ask yourself the following questions and journal your answers.
- Consider whether you are becoming more aware of your reactions.
- When was the last time I felt happy at work? Why did it make you happy? How did you react?
- Do I have colleagues that I like at work? What values do I like about them?
- When did I last feel stressed at work? Why was it stressful? How did I react?
Complete this exercise once a month and review your answers from the previous month.
Do you notice any differences?
Self-regulation
Self-regulation is the ability to manage your own impulses, energy, and moods and to think before you act. This is particularly useful when you apply this to managing your capacity at work and how you react in a professional environment. We probably all know the impulsiveness that comes with working behind a computer screen; less actual face-to-face time, brisk deadlines and the sometimes unavoidable insularity of coding can mean that you can get stuck in your head and forget how to regulate yourself when it comes to interacting with other human beings.
For example, let’s say we’re a junior developer who has just started learning Java. They see a high priority ticket in the sprint, weighted at around 8 points. We all know the feeling. We want to impress and please our team. But we don’t have the skills needed to complete the work, especially in a specific timeframe. Self-regulation, in this case, will mean that you decline to pick up the ticket but maybe offer to pair or review the work of the more senior developer who picks it up. Sure, you’re turning down an opportunity to shine but you’re also not being controlled by your pride and accepting work which will be stressful to complete well. Instead, self-regulation helps you to make a decision that is realistic and benefits the team, as well as the business you work for.
This might present as getting irritated at correcting a colleague’s code format for the umpteenth time (despite also asking them to install a linting extension in VS Code) and writing a slightly too direct comment on their latest merge request. With a few grumpy exclamation marks to boot.
When you are unable to self-regulate, you react in ways that are driven by your emotions, which isn’t always appropriate in a professional setting. Outbursts like the one above are likely to make your colleague more hesitant to ask for your help when they next have a merge request to review, for fear of getting the same reaction. Over time, reactions like this lead to a less collaborative environment. Had you been able to self-regulate and calmly explain why the changes needed, your colleague would’ve made the adjustments and would trust you as a source for support in future.
Motivation
What motivates you? Many of us working in tech are lucky to be well paid, have interesting projects, a work-life balance, and have supportive colleagues (or, at least a mixture of some of these).
But does any of this motivate you intrinsically?
It may well be that none of these motivate you, which is OK. Understanding what drives you will help you write and keep writing the best code you’ve ever written. If the going gets tough, you’ll already know how to tap into your innate ambition and stay focused and positive. You’ll also be more likely to take the initiative to take charge of your own career and create your own opportunities, as opposed to following the path set out by your employer or what is expected of you by others.
This is not about promoting ‘hustle culture’, but more to highlight the importance of knowing what keeps you going and cultivating a proactive mindset which means you are ready and motivated when opportunities that align with your goals present themselves.
- When do you work best? Are you an early bird or a night owl? This will help you decide when to pick up less appealing work (i.e. when you have the most energy or feel most productive).
- What sort of work do you enjoy? Do you love working on frontend projects? Does completing integrations with third party software make you excited? Communicate when you feel bored or unstimulated, so that you can receive work that you find interesting.
Empathy
Empathy is the awareness of the feelings, needs, and concerns of others. Being aware of how others experience the world means that as a developer, you are better able to communicate and build relationships with lots of different people.
Take our example earlier of writing an irritated comment in response to a mistake on a merge request. When exercising empathy, you may consider whether your colleague has made a mistake because they are stressed or whether code quality standards are communicated clearly across the department. You would then share your feedback on the merge request calmly and perhaps check in with this colleague.
To be clear, empathy is not about lowering your standards or cutting people too much slack. It’s about considering others and considering how your actions may impact them. A good example of exercising empathy is setting easy-to-understand variable names. Underpinning a key principle of clean code, setting variable names which are easy to search, intentionally named, and describing the logic of the variable makes life much easier for the next developer who comes along and has to work out what the code does. This contributes to how easy a system is to maintain or re-architect. Ever designed an API? Developers are your users, so develop and publish an API and related resources that are simple and if possible, include a feedback option so your users can ask questions. At Taxdoo, we offer Developer Support for our API via Reddit, so that developers can read discussions and share knowledge.
Ever heard of Ubiquitous Language? Eric Evans coined this term in Domain Driven Design to describe the practice of establishing a language between users and developers, based on the Domain Model. By using empathy to develop Ubiquitous Language, we then have a framework of communication between developers and business domain experts that makes the feedback for testing or developing a product clearer and much more impactful.
Being aware of how others feel is also key if you aim to become a leader. People gravitate towards those who can unite a diverse group of people and bring out the best in them. Highly empathetic people are also more likely to be able to acknowledge and successfully navigate political situations at work in a way that delivers results, for example, securing promotion for a direct report or receiving more resources to better complete a project, without compromising their integrity or neglecting the development of their team.
Social Skills
Social skills are just for social butterflies and extroverts? Of course not! Even for the most shy or introverted, social skills can be developed in an authentic way so that you can connect and work with others. Social skills cover a breadth of qualities; the ability to communicate (think honestly and clearly, rather than chatty and convoluted), the ability to build trust and bonds with colleagues and most powerfully, to yield influence based on the high regard that your colleagues hold you in.
Let’s uncover another myth: having good social skills is not about being popular or striving to make everyone like you. Social skills are about presenting yourself authentically, being an uncomplicated person to work with, and being someone who can mentor, manage and resolve disagreements in a way that builds trust, rather than erodes it. In many organizations, people who possess brilliant social skills can also use this to spark change in a positive way. Does the company want to become agile? Advocates will be selected based on their sphere of influence to spearhead a cultural shift and ensure that the adoption remains high.
At the end of the day, we know that Emotional Intelligence is often overlooked as a ‘mere soft skill’. We like to measure success with cold, hard metrics. So why care about Emotional Intelligence, especially in a logic-driven field such as software engineering? Because a high IQ alone is not enough to achieve success.
Much as we are expected to have multiple skills and areas of knowledge as an engineer, to work sustainably and be more impactful, we need to address how we behave, react, and present ourselves at work. The great thing about EI is that it puts the focus back onto personal growth, emotionally and mentally, as opposed to professional growth, which focuses on acquiring new skills and experiences to remain competitive.
Combining both and suddenly, we, as engineers and tech professionals, can sustainably deliver value as well as grow as individuals.
Not sure how to approach this subject with your team? Share this article with trusted colleagues on chat messenger, ask them to read it, and see what they think. Perhaps it will spark a healthy debate on what processes a team or department could work on to promote a culture of emotional intelligence.
Or if a problem keeps arising around code reviews or difficult-to-understand documentation, use this article as a conversation starting point for addressing these issues in retros or post-mortems. It is good to note that in some organizations which are purely results driven or where mental health or wellness at work is not prioritized, that the topic of Emotional Intelligence may be viewed negatively or could cause someone to take offense. Not everyone thinks the same or is as progressive as you’d hope them to be, so consider before you decide to raise this topic in your workplace.
We hope that you found this article. Please feel free to share your feedback or experiences with us!
Maria, Engineering Manager at Taxdoo, delivered a presentation on Emotional Intelligence in Software Engineering at the FemTech Conference in 2023. Covering the definition of Emotional Intelligence, management psychology, the professional benefits of high Emotional Intelligence to practical tips on how to improve your own emotional intelligence, her talk was a deep dive into EI that aims to provide practical ways to improve your own EI whilst supporting your team in an EI-positive environment.
You can’t improve what you don’t measure.
These words of wisdom are often attributed to the famous management guru and thinker, Peter Drucker, and, especially in the context of modern software engineering, have never been more relevant. Measuring things is something we have been doing for thousands of years, it is a concept that we are very familiar with. Metrics mean that success and failure can be measured in a quantitative way. Data gathered and analysed within a metrics-driven environment enables engineering teams to regularly pulse-check important projects and make informed decisions, rather than relying solely on verbal discussions or waiting until a piece of work is complete. At Taxdoo we like to take time to identify what we can improve, take steps to enhance our products and empower our teams according to the data that we collect.
I’d like to invite you to share a glimpse of the Taxdoo Engineering culture and with an introduction to Engineering Metrics, including the top five metrics which I recommend.
What are Engineering Metrics and why are they useful?
Engineering metrics are a quantitative or countable measure of software characteristics. When we talk about software characteristics we include different aspects that influence software development.
As you develop software there are many factors at play. We need to measure those factors to have a better understanding of the effort, size and cost estimation. Engineering metrics can also help us with other aspects: we can refine our productivity, influence our team culture and identify improvements in the quality of our software.
As Engineer Managers, we want to identify areas of improvement, manage the workloads of our team, increase return on investment and reduce overtime and costs. They are necessary to understand how our team, department and company perform and they can provide valuable insights for the future.
Engineering Metrics vs. Engineering KPIs
We often hear Engineering Metrics and Engineering KPIs and sometimes they are confused. Even though both are metrics your organisation needs to measure and perform to make progress with the company strategic plan. The difference between them is that KPIs measure progress on specific business goals and metrics are quantitative measurements used to track performance of processes at an operational level (thanks to Datapine for the extensive explanation). Both provide what needs to be measured to achieve your long-term objectives.
Metrics should provide value
As organisations, we need to make sure that we are making the right decisions based on the correct data. We need to be aware of the way we prioritise and measure this data as it can also be counterproductive: extracting insights from data is time intensive, so make sure that the data sources used are reliable and relevant for your team or department.
There are also other metrics that could influence the mood of the team. Measuring how many lines of code a person produces not only causes unnecessary stress to developers but also will show that their managers do not understand code quality. A developer producing more lines of code does not necessarily mean that a programmer is more productive. At Taxdoo, as one of our values is trust, we are against micromanaging our team members and we follow principles like KISS (Keep It Simple, Stupid) or YAGNI (You aren’t gonna need it) to promote a healthy, solution-orientated engineering culture. Therefore metrics like “lines of code” or “how many commits a developer does” aren’t metrics that we are interested in.
Types of Engineering Metrics
There are several types of categories that we can classify our engineering metrics depending on which areas they focus. Although some of those metrics could fall into different categories, I’ve divided them into these three categories:
Team metrics
This category focuses on the metrics that help the team, improve developer happiness, contribute to a good environment, evaluate processes implemented by the team and identify pain points that the developers experience day to day.
Here are some examples:
Context switching: context switching indicates how often team members have to move from one issue to another because of blockers. If there’s a lot of context switching, it signifies that the team is inefficient.
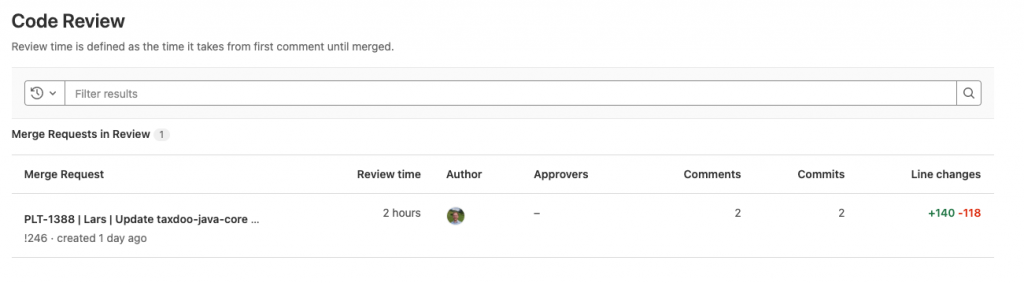
Code Review Response: Many developers are idle because they are waiting for a code review, to unblock developers or dependencies to other tickets. A code review that takes too much time or effort to get response could become obsolete and it will be harder to merge back to the main branch.
Meetings: How many minutes developers spend in meetings every week. Reviewing this is a quick way to optimise developers’ time and remove unnecessary meetings.
Product metrics
This type of metric will focus on the product itself: size, quality of the features, reliability, design. These metrics focus on providing the best value for the user.
Examples:
Monthly active users: This is one of many engagement metrics,which focus on how and how often users interact with your product. Those who engage with your product are considered active users and increasing the number of them is important for your company’s growth.
Number of sign ups: With this acquisition metric we can measure when somebody first starts using our service. With the number of sign ups we can also have an idea of how many users our system should be able to deal with.
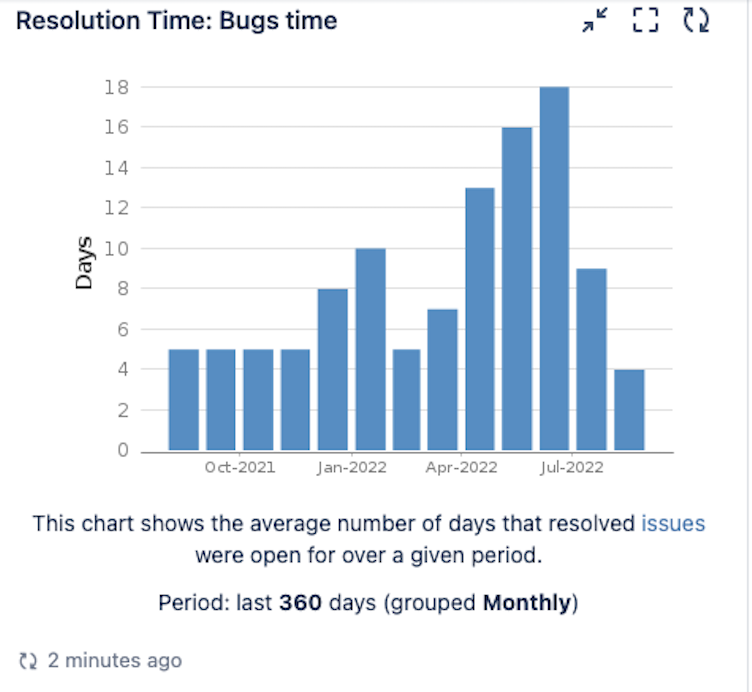
Bug response time: This is a metric that will help to provide a better service to the end user. It will measure how long it takes to react and resolve a bug. If a user has problems and finds a bug we want to solve it as soon as possible.
Project metrics
This category is for measuring if we are using the resources to their fullest potential. They track the performance of the engineering projects.
High risk files: This metric indicates the files that have a high rework percentage. The risk is bigger when you have to make more changes. Therefore, files with a high rework percentage also have more risk that could lead to low quality.
System cost: this is part of the monetization metrics, we need to know how much our system costs so we can calculate how much net revenue we can get from our users.
Number of hotfixes: With the number of hotfixes we can see how many unplanned urgent changes need to happen, which will indicate what may have been overlooked when we merged that code.
How to implement them?
There is no right way to implement Engineering Metrics. As the needs of each organisation and engineering team differs, it is important to select KPIs and metrics which consider these unique requirements. A good start is for each organisation to evaluate which metrics are relevant for them and work with the APIs or data available from the tools that they are using.
However, there are some tips I would like to mention regarding the implementation of Engineering metrics.
Engineering metrics should be:
Those metrics should be automatic, the work to generate them should be minimum.
As part of day to day work: It doesn’t matter if the metrics are easy to create if using them in the day to day work is cumbersome. People will stop using them.
If you have several metrics, it is very important to have one dashboard to display all of them. Reading them should take a couple of minutes.
My top 5 Engineering Metrics
Downtime:
Downtime will indicate that our systems are not available, this can be because our provider has some problems or because we introduce something that requires a system shutdown.
It will mean something different depending on the project:
- The user can’t access the system
- Real-time processing stalls for at least 10 minutes
- Number of 500 Errors
Developer Disturbance:
Developer Disturbance will point out ad hoc or not planned tasks or requests that reach developers. The same as Downtime, this will depend on the project and team. We need to identify what is a developer disturbance. It can be the number of meetings and it can be measured as meeting time as previously mentioned, it can be the amount of requests from other departments or the recurrent tasks that haven’t been planned and they need to be taken immediately.
Bugs created vs Bugs resolved:
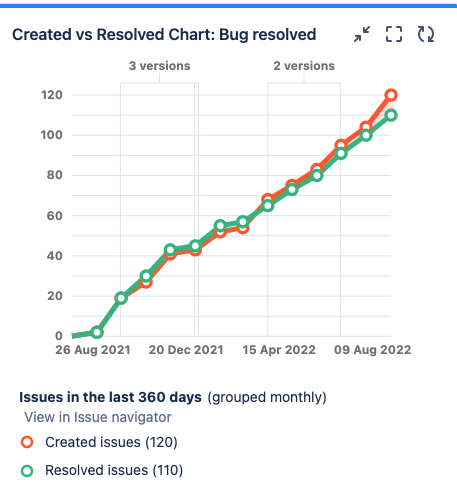
We can track how many bugs usually appear and how we react to them.
Failed Deployments:
Failed deployment: the name says it all. It can be measured as the time delay for live code to be released into production or decreased lead time for changes, etc. And it will show if this team might need help with their CI/CD.
Project Vulnerability Status & Grade of Projects:
With this metric one can integrate a security scan to check the vulnerability of the dependencies. We also check with this metric our compliance framework and scan licensing.
In conclusion
As mentioned earlier, all metrics will vary based on the needs of your business and structure of your engineering team. What’s important is to take at least two quarters to a year for the metrics to allow new processes and goals to embed, with regular monthly pulse checks along the way. By regularly evaluating metrics over a specific period of time, you can make adjustments to ensure these metrics suit your team and are contributing value by bringing you closer to achieving business goals.
Do you also have recommendations or success stories on engineering metrics?
Recommended Reading:
These toggles are more useful than we give them credit for
At Taxdoo, having a safe mechanism to test our products before they reach our clients is of the utmost importance. To achieve this, we started utilising something that we call feature flags. Today, I would like to take you on a journey to explore what exactly feature flags are, and what are the benefits they could bring to your projects.
What Are Feature Flags (a.k.a Feature Toggles)?
To make it as simple as can be, feature flags are a technique that provides features, or part of code, behind a toggle or flag that is easily controlled outside of the code itself. These toggles, or variables as we also refer to them, are used in conditional statements to toggle what is inside based on the value of that feature toggle.
In even simpler terms, Feature flags come in handy most when you want to test changes in your code but it’s often not possible or practical to deploy them to all of your users at once. Instead, you can use these useful toggles to enable or disable the new code on a per-user basis.
Advantages of Using Feature Flags
There are many benefits to implementing these useful toggles as part of your daily practice, however, the biggest one must be that they are a great way to test all these new features you’ve been working on for so long. For example, you can use feature flags to control whether users get access to new features, and when they do. This allows you to avoid having problems in the rest of your application if there is an issue in one area only.
Feature flags don’t block the deployment of your codebase or prevent any changes from being made while they’re running live on production servers. You can always add or remove them as needed after launch without affecting other parts of your application’s functionality or performance, so it’s easy for teams at all levels to work on critical parts of our applications and still be able to deploy them with confidence!
Feature flags are just one tool in your arsenal, but they’re a very useful one. You can use them to test new features and roll out changes gradually to prevent problems from affecting the rest of your application. They also make it easy for different teams at all levels to work together on critical parts of our applications without affecting their functionality or performance.
Business toggles
A business toggle is what we describe as an enhancement that we want to add only for specific users. This could be anything from pricing changes (e.g., allowing more than one price tier), to a marketing campaign (e.g., showing only during certain times of day).
The point is that we need to know as much as possible about our users to create a personalised experience. As a result, we can tailor content and design elements based on user preferences, which makes them more likely to stick around longer. Or at least until they get bored with the site. Well, let’s hope we don’t get to that point. Another way to call this technique would be a Canary Release.
As there’s much more to cover on different types of feature toggles, one of my favorite developers, Martin Fowler, has actually made a very in-depth review for those who want to know more. If you’re one of them, feel free to read his article here.
Feature flags aren't just about making things easier
Feature flags are a great way to make your code easier to change and improve. But, they can also introduce complexity to your project. For instance, if you have multiple features, you must understand what they’re doing, who has access to them, and where their data comes from.
The problem with feature flags is that they aren’t just about making things easier; they’re also about making sure everyone knows what’s going on in the codebase. So, if there’s a wide excess of information circling around different developers and none of them assign clear ownership of these bits, this is when we reach the state of “feature creep”.
Little tip: Feature creep is when the scope of a project expands beyond its original goals. This can happen in any software project, but it’s especially common in large projects with many stakeholders who have different ideas about what should be included or excluded. In other words, we don’t like feature creeps!
GitLab Feature Flags service for Front-end
You can use feature flags in many ways but today, I would like to talk about an MVP (aka Minimal Value Product) solution, which makes it easy to handle Feature toggles across different projects in the Front end by using Gitlab.
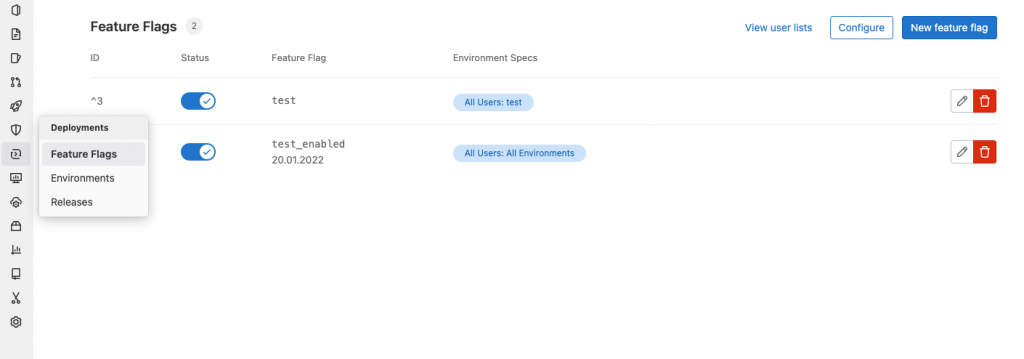
GitLab has a Feature Flag service which comes in handy in many situations. To create one and manage them, you just need to go to Deployments -> Feature Flags. You will see this view where we can enable and disable the Feature Flags and we can also see the environments where we can see these feature flags.
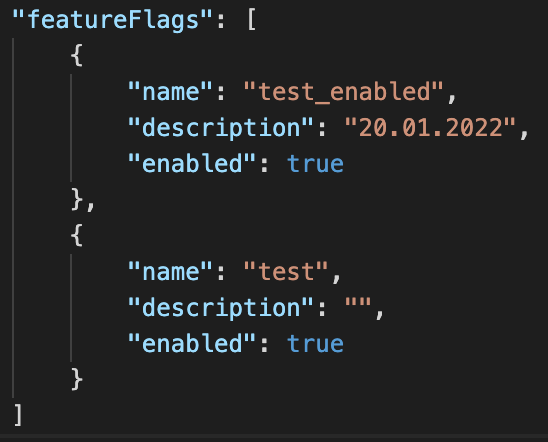
Once the Feature Flags are created in GitLab we need to use the Unleash service to retrieve the information. The Unleash allows us to know how many Feature Flags we have configured in the project and the information about them. For the Front End to use Unleash service they need to be connected via the Unleash Proxy or we could build a small Backend that uses the Unleash SDK for our Front End projects to use.
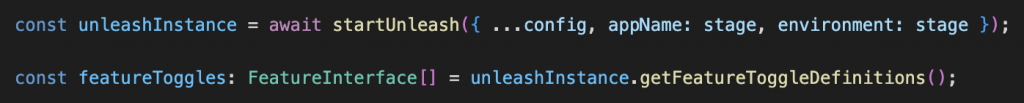
As in this case we want to use Feature Flags in several Front End projects, we choose the solution of building a small node.js project that retrieves the list of feature flags of a specific project. So we just need to install the client, initialise it with the info from GitLab and ta-daaaah! We have our project Feature Flags!
Later in your Front End application you just need to access it with featureFlags[‘myFeatureFlag’].enabled to toggle a button that you don’t want to show, or a page, for example. I would recommend calling this service when you load your application and storing it somewhere globally, so you don’t end up in a situation where you need to call the backend many times.
Some closing words
As you already saw, Feature flags are a great way to help teams find the right features and priorities for their products. Worth mentioning is that this is the approach that we use at Taxdoo,however, there are many different ways to handle this technique and I would love to hear your opinion, if you’d like to share. Do you use Feature flags? If yes, how do you implement them?
Stick around for some more interesting Dev-related content as we turn our blog more and more into the guide to the world of Taxdoo.
See you soon!

We’ve all been there; a new project drops onto your team’s plate and it’s a scramble to hit the deadline. What usually gets hit hardest? CSS styling. Short deadlines, sub-standard architecture or lacking guidelines means that often CSS becomes the problem child in terms of delivering clean code.
At Taxdoo, we use a range of styling methods for our frontend projects, however a prime example of CSS styling can be seen in our website. Like many company’s websites, Taxdoo.com is the digital shop door for the thousands of customers who visit our site daily.
An inhouse-built site made with React, we are constantly looking for ways to optimise the performance, aesthetics and functionality of our key marketing tool.
What is clean code?
Epitomised by software expert Robert Cecil Martin’s (otherwise known as Uncle Bob) book, Clean Code: A Handbook of Agile Software Craftmanship, clean code refers to agile principles of software development that aim to create code that is simple to understand or change. Dead code refers to code that is not used when an application is run.
What is clean code for CSS?
In CSS, short for Cascading Style Sheets, is the way that property values are applied to the content as a hierarchy. Child elements can either inherit or override properties values from the parent elements. If this hierarchy is not properly adhered to or the team uses bad practices, it can seriously affect a website’s performance. That’s why it is important to optimize and try to keep the CSS clean.
Over time, while we add more features or just small modifications to HTML elements, the CSS can grow quickly and it becomes a challenge to maintain, especially if you don’t stick to the YAGNI principle (“You aren’t gonna need it”, only code the functionality that it is needed) in mind.
Eventually, you need to delete unused CSS or optimize it.
CSS frameworks can take a project load to 140KB of CSS or more, which is a lot and can take a long time to render. This size is also possible when you have a lot of templates and pages, and if you aren’t using all of it, having tools to reduce size and delete dead code is totally worth it.
Why is it good to remove dead code?
Dead CSS will affect the rendering time of your website. Using Lighthouse provides a good overview of potential savings you could make in load-time by removing dead CSS, as well as scoring your website on other categories such as SEO, Performance, Accessibility and Best Practices.
How do we detect dead code?
One of the tools that we like to use is Coverage from Google Chrome. To open this feature from Chrome, you need to open the Developer tools and click coverage in the 3 dots at the bottom left.
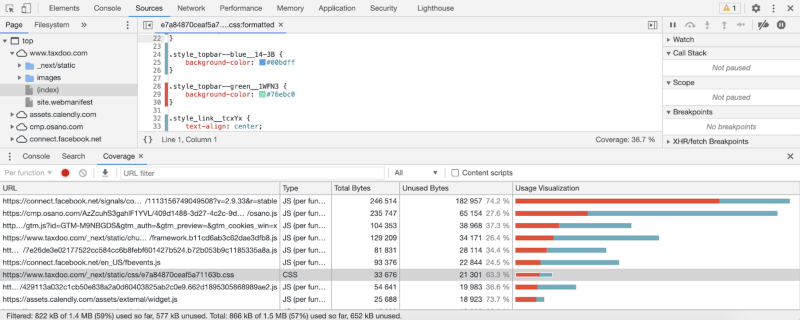
There we will see a list of JS/CSS files with bars in red and blue color. The red color means the amount of code unused and the blue color is used. It also shows the percentage of unused Bytes. Whenever you click one of those elements from the list, it will open that file and you can check which part is not being used because it will show a red bar next to it.
This is only visible for the page you are in, when you visit more pages or do more actions in the page this will get updated. Seeing a lot of red doesn’t really mean you should delete it. It could be used in another part of the website, so do not take this chance to delete them because you could end up with big styling problems. To know if a CSS selector is not being used you need to check every single page or state of your site and execute all javascript.
This tool is useful to get an idea if a piece of CSS is being used, for example, if we have a specific component, we visit that component and see how much unused CSS we have.
Other ways to detect dead CSS
To analyse your code and find unused CSS, you can use several automated tools:
PurifyCSS and PurgeCSS are the most frequently used ones and they can be integrated in the build process, while UnusedCSS is a website that checks and gives you a report of your CSS usage.
To avoid having unused CSS, make sure that you scope your components and maintain a good structure. It is difficult to have unused CSS with smaller components since if the component is removed, so is the component’s CSS. However, if you end up with a bigger project or your components grow a lot, it’s worth regularly checking your CSS and trying to clean it.
What do you use to detect or remove dead code?