Engineering Metrics: Take your team to the next level
You can’t improve what you don’t measure.
These words of wisdom are often attributed to the famous management guru and thinker, Peter Drucker, and, especially in the context of modern software engineering, have never been more relevant. Measuring things is something we have been doing for thousands of years, it is a concept that we are very familiar with. Metrics mean that success and failure can be measured in a quantitative way. Data gathered and analysed within a metrics-driven environment enables engineering teams to regularly pulse-check important projects and make informed decisions, rather than relying solely on verbal discussions or waiting until a piece of work is complete. At Taxdoo we like to take time to identify what we can improve, take steps to enhance our products and empower our teams according to the data that we collect.
I’d like to invite you to share a glimpse of the Taxdoo Engineering culture and with an introduction to Engineering Metrics, including the top five metrics which I recommend.
What are Engineering Metrics and why are they useful?
Engineering metrics are a quantitative or countable measure of software characteristics. When we talk about software characteristics we include different aspects that influence software development.
As you develop software there are many factors at play. We need to measure those factors to have a better understanding of the effort, size and cost estimation. Engineering metrics can also help us with other aspects: we can refine our productivity, influence our team culture and identify improvements in the quality of our software.
As Engineer Managers, we want to identify areas of improvement, manage the workloads of our team, increase return on investment and reduce overtime and costs. They are necessary to understand how our team, department and company perform and they can provide valuable insights for the future.
Engineering Metrics vs. Engineering KPIs
We often hear Engineering Metrics and Engineering KPIs and sometimes they are confused. Even though both are metrics your organisation needs to measure and perform to make progress with the company strategic plan. The difference between them is that KPIs measure progress on specific business goals and metrics are quantitative measurements used to track performance of processes at an operational level (thanks to Datapine for the extensive explanation). Both provide what needs to be measured to achieve your long-term objectives.
Metrics should provide value
As organisations, we need to make sure that we are making the right decisions based on the correct data. We need to be aware of the way we prioritise and measure this data as it can also be counterproductive: extracting insights from data is time intensive, so make sure that the data sources used are reliable and relevant for your team or department.
There are also other metrics that could influence the mood of the team. Measuring how many lines of code a person produces not only causes unnecessary stress to developers but also will show that their managers do not understand code quality. A developer producing more lines of code does not necessarily mean that a programmer is more productive. At Taxdoo, as one of our values is trust, we are against micromanaging our team members and we follow principles like KISS (Keep It Simple, Stupid) or YAGNI (You aren’t gonna need it) to promote a healthy, solution-orientated engineering culture. Therefore metrics like “lines of code” or “how many commits a developer does” aren’t metrics that we are interested in.
Types of Engineering Metrics
There are several types of categories that we can classify our engineering metrics depending on which areas they focus. Although some of those metrics could fall into different categories, I’ve divided them into these three categories:
Team metrics
This category focuses on the metrics that help the team, improve developer happiness, contribute to a good environment, evaluate processes implemented by the team and identify pain points that the developers experience day to day.
Here are some examples:
Context switching: context switching indicates how often team members have to move from one issue to another because of blockers. If there’s a lot of context switching, it signifies that the team is inefficient.
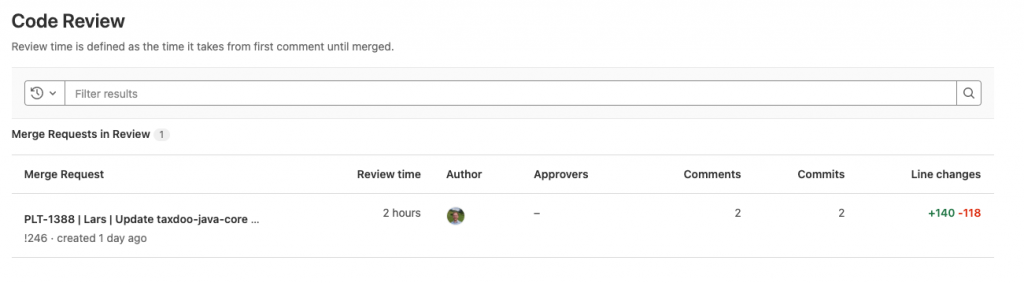
Code Review Response: Many developers are idle because they are waiting for a code review, to unblock developers or dependencies to other tickets. A code review that takes too much time or effort to get response could become obsolete and it will be harder to merge back to the main branch.
Meetings: How many minutes developers spend in meetings every week. Reviewing this is a quick way to optimise developers’ time and remove unnecessary meetings.
Product metrics
This type of metric will focus on the product itself: size, quality of the features, reliability, design. These metrics focus on providing the best value for the user.
Examples:
Monthly active users: This is one of many engagement metrics,which focus on how and how often users interact with your product. Those who engage with your product are considered active users and increasing the number of them is important for your company’s growth.
Number of sign ups: With this acquisition metric we can measure when somebody first starts using our service. With the number of sign ups we can also have an idea of how many users our system should be able to deal with.
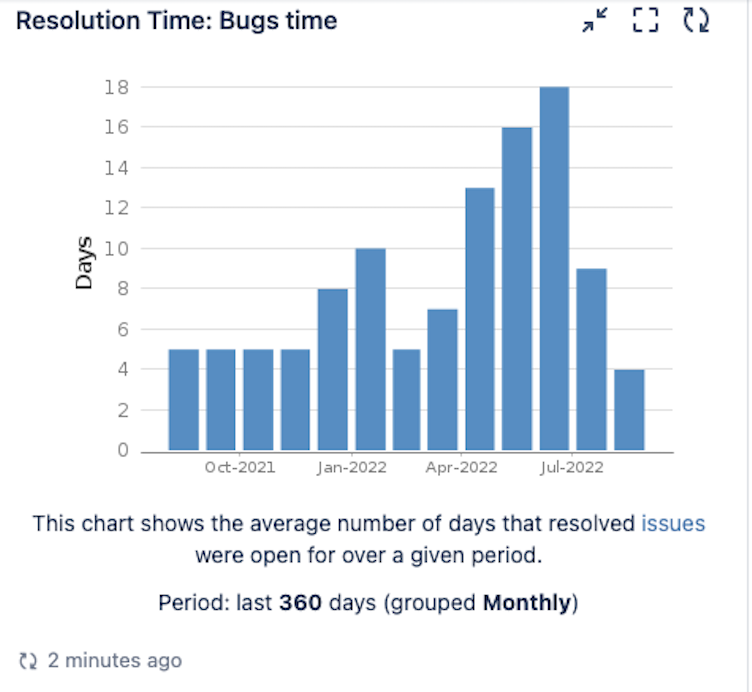
Bug response time: This is a metric that will help to provide a better service to the end user. It will measure how long it takes to react and resolve a bug. If a user has problems and finds a bug we want to solve it as soon as possible.
Project metrics
This category is for measuring if we are using the resources to their fullest potential. They track the performance of the engineering projects.
High risk files: This metric indicates the files that have a high rework percentage. The risk is bigger when you have to make more changes. Therefore, files with a high rework percentage also have more risk that could lead to low quality.
System cost: this is part of the monetization metrics, we need to know how much our system costs so we can calculate how much net revenue we can get from our users.
Number of hotfixes: With the number of hotfixes we can see how many unplanned urgent changes need to happen, which will indicate what may have been overlooked when we merged that code.
How to implement them?
There is no right way to implement Engineering Metrics. As the needs of each organisation and engineering team differs, it is important to select KPIs and metrics which consider these unique requirements. A good start is for each organisation to evaluate which metrics are relevant for them and work with the APIs or data available from the tools that they are using.
However, there are some tips I would like to mention regarding the implementation of Engineering metrics.
Engineering metrics should be:
Those metrics should be automatic, the work to generate them should be minimum.
As part of day to day work: It doesn’t matter if the metrics are easy to create if using them in the day to day work is cumbersome. People will stop using them.
If you have several metrics, it is very important to have one dashboard to display all of them. Reading them should take a couple of minutes.
My top 5 Engineering Metrics
Downtime:
Downtime will indicate that our systems are not available, this can be because our provider has some problems or because we introduce something that requires a system shutdown.
It will mean something different depending on the project:
- The user can’t access the system
- Real-time processing stalls for at least 10 minutes
- Number of 500 Errors
Developer Disturbance:
Developer Disturbance will point out ad hoc or not planned tasks or requests that reach developers. The same as Downtime, this will depend on the project and team. We need to identify what is a developer disturbance. It can be the number of meetings and it can be measured as meeting time as previously mentioned, it can be the amount of requests from other departments or the recurrent tasks that haven’t been planned and they need to be taken immediately.
Bugs created vs Bugs resolved:
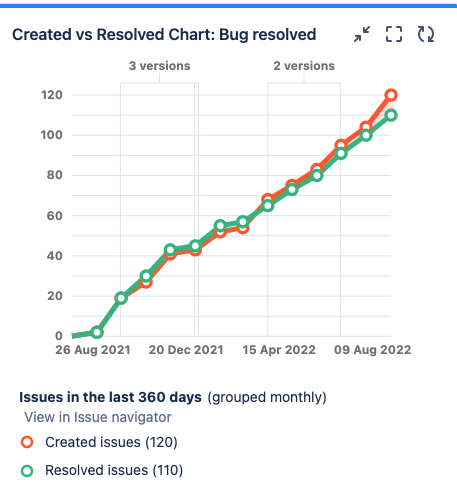
We can track how many bugs usually appear and how we react to them.
Failed Deployments:
Failed deployment: the name says it all. It can be measured as the time delay for live code to be released into production or decreased lead time for changes, etc. And it will show if this team might need help with their CI/CD.
Project Vulnerability Status & Grade of Projects:
With this metric one can integrate a security scan to check the vulnerability of the dependencies. We also check with this metric our compliance framework and scan licensing.
In conclusion
As mentioned earlier, all metrics will vary based on the needs of your business and structure of your engineering team. What’s important is to take at least two quarters to a year for the metrics to allow new processes and goals to embed, with regular monthly pulse checks along the way. By regularly evaluating metrics over a specific period of time, you can make adjustments to ensure these metrics suit your team and are contributing value by bringing you closer to achieving business goals.
Do you also have recommendations or success stories on engineering metrics?
Recommended Reading: